Product
Stefano Braganti
Million-Point Telemetry for Construction: Stop Guessing, Start Winning
Turn site data into decisions: the key construction KPIs, telemetry sources, and workflows to cut costs and hit schedule.

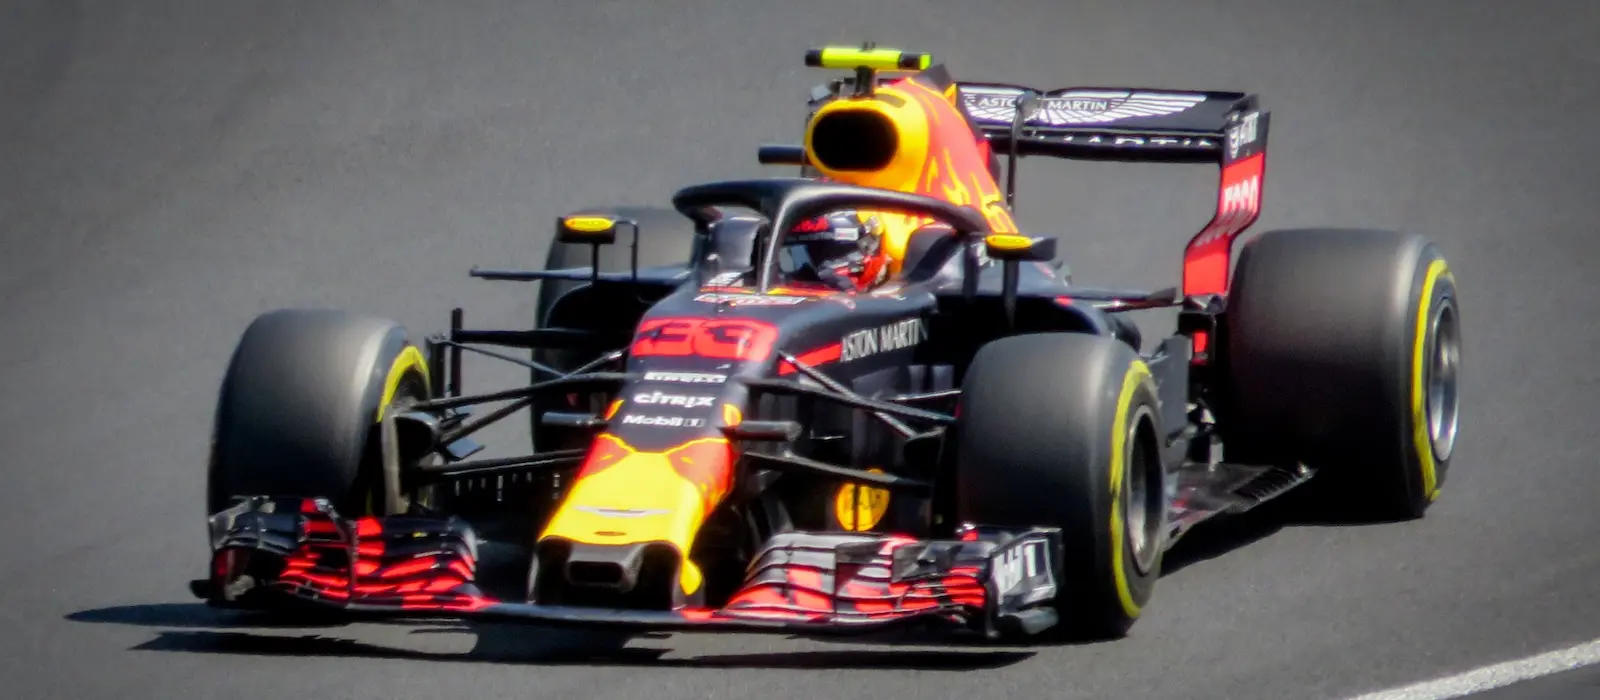
If Max Verstappen Tunes His Red Bull With 1 Million Data Points a Second, Why Are You Awarding Multimillion-Dollar Trades on Gut Feel?
During every Grand Prix lap, Verstappen's RB20 streams over a million data points per second from 300+ sensors: tire temps, brake energy, aero vortices, even the G-force on his headrest. Red Bull's pit wall ingests that torrent, spots a half-degree tire delta, tweaks strategy, and–boom–two tenths shaved off the next lap. No drama, just data.
Now picture your own project: $250 million on the line, hundreds of workers, weather, change orders, inspectors, owners, lawyers… and you're still deciding which subcontractor to trust because "those folks seem solid". That's like the Team Manager picking a race engineer because he looks fast in the paddock.
You already capture mountains of raw numbers: badge swipes, daily logs, safety observations, tool rentals, RFIs. They rot in silos while crews improvise. Flip that data on and you can track metrics that matter:
| Metric | Why it matters | One-line math |
|---|---|---|
| Stable Manpower Index (SMI) | Rewards crews that stay intact—directly tied to productivity & safety. | Mandays × (1 – Turnover %) |
| Stability Density | Exposes churn factories vs. craft teams. | (Mandays ÷ Unique Workers) × (1 – Turnover %) |
| Incident-Free Hours / 1,000h | Leading safety indicator—beats lagging TRIR. | (Total hours – incident hours) ÷ 1,000 |
| Rework Ratio | Early warning of quality failures. | Rework hours ÷ Total hours |
| Tool Utilisation Index | Stops renting idle lifts. | Active tool hours ÷ Available tool hours |
| RFI Velocity | Finds drawing packages that stall production. | Avg. days RFI → answer |
| Punch-List Density | Pure first-time-quality score. | Punch items ÷ 10,000 ft² |
Every input lives in your site already. The only missing piece is a platform that actually connects the dots…
We're not a badging company. Yes, we handle kiosks, turnstiles, and QR codes—but that's just the sensor layer. The engine is our data model:
Real-time dashboards blend access logs, preshift reports, incident waivers, equipment check-ins, and Sentinel's DOB/311 feeds.
Auto-calculated KPIs (SMI, Stability Density, Incident-Free Hours, RFI Velocity) refresh every night—no Excel voodoo.
Leaderboards show which subs crush their targets and which ones hemorrhage headcount.
Alerts & workflows kick off the moment turnover spikes or punch-list density drifts above tolerance.
In short, SafetyClerk gives CMs and subs the same visibility Red Bull has over Verstappen's gearbox—so you can adjust this week, not on the post-mortem.
Schedule compression: Crews with SMI > 2,000 person-days finish work ≈ 18% faster. That's a float you can resell.
Insurance leverage: Documented low turnover + incident-free hours = demonstrably lower risk profile. Bargain your EMR and CCIP costs down.
Cost control: Rework Ratio + Tool Utilisation Index stop silent leaks that add 5–7% to every bid.
Vendor accountability: Publish the SafetyClerk leaderboard in the trailer. Subs hate being at the bottom more than they fear a backcharge.
Owner confidence: Hard numbers beat glossy progress photos. Data-driven reports calm lenders—and unlock their next cheque.
You wouldn't hire Verstappen and then cover his dashboard with duct tape. So why hire a concrete crew without asking for:
If they can't show it, either they don't track it—or they're afraid you'll see it.
| Week | Milestone | Outcome |
|---|---|---|
| 1 | Plug SafetyClerk into your access control, daily log, and Sentinel feeds. | Live headcount & turnover map. |
| 2 | Back-load 90 days of history. | Baseline SMI, RFI Velocity, Rework Ratio. |
| 3 | Launch dashboards & leaderboards. | Real-time alerts, weekly scorecard emailed Monday 6 a.m. |
After that, iterate like Red Bull: tweak thresholds, add new KPIs, keep shaving seconds—and dollars—off every cycle.
Verstappen wins because Red Bull treats every lap as an experiment: measure, diagnose, adjust, repeat. Construction can do the same—if we stop pretending Friday's timesheets and Monday's toolbox talks are "data."
SafetyClerk already crunches the numbers. All you have to do is decide whether to keep racing in the dark…or turn on the telemetry and start lapping the field.
Ready to see your crew's SMI—or prove you're the Verstappen of subcontractors? Let's fire up the dashboard.
Product
Stefano Braganti
Turn site data into decisions: the key construction KPIs, telemetry sources, and workflows to cut costs and hit schedule.

Product
Guido Iaquinti
SafetyClerk + Procore: automate safety docs, boost visibility, and streamline compliance—no more manual uploads or missing records.

together
SafetyClerk is the construction management platform that makes safety compliance, and risk management of your job site simple and visible in one click.
Stay on
the loop!
ConstructionClerk - 2026 - All rights reserved
ConstructionClerk - 2026 - All rights reserved